
 Available in US
Content

I placed my first Rugby World Cup outright bet in 2011 — a tenner on France at what I remember being around 14/1. They reached the final, lost by a single point, and the slip went in the bin. What stayed with me was the realisation that I had no framework for deciding whether 14/1 was generous, fair, or terrible. I just liked France’s back row. A decade and a half later, I make a living dissecting exactly that question, and rugby world cup odds remain the single most misunderstood element of tournament wagering.
The global sports betting market generated $100.9 billion in revenue in 2024 and is on track to reach $258.11 billion by 2033. Rugby is riding that wave harder than most: betting ticket volume on the sport tripled through Sportradar’s Managed Trading Services between 2019 and 2023. Those numbers tell you that more people than ever are staring at RWC outright prices, match handicaps and try scorer lines — yet most still cannot explain what those prices actually represent.
This guide exists to fix that gap. I am not going to give you a table of the latest outright prices and tell you to back New Zealand. Instead, I will walk you through how odds are constructed, why they move, what implied probability reveals about the bookmaker’s real opinion, and — most importantly — how to spot the moments when the market is offering you more than it should. Everything here applies to RWC 2027 specifically, but the principles will serve you through any tournament cycle.
If you have never converted a fractional price into a decimal, start at the next section. If you already know your 5/1 from your 6.00, skip ahead to implied probability — that is where the real edge begins.
Three Odds Formats, One Price — Fractional, Decimal and American Explained
A few years ago I was at Twickenham watching England play South Africa and overheard two blokes arguing at the bar. One insisted 9/2 was a better price than 5.50; the other was equally sure 5.50 paid more. They were looking at the same market, the same selection, at the same moment — just expressed in different formats. Neither realised they were both right, because 9/2 and 5.50 are identical. That conversation captures the confusion that still trips up otherwise sharp punters.
Fractional odds are the UK default and the format you will see on most high-street boards and traditional British bookmaking sites. The number before the slash is your profit relative to the number after it. At 5/1, every pound staked returns five pounds of profit plus your original stake — six pounds total. At 9/2, a two-pound stake yields nine pounds profit, so a one-pound stake yields four pounds fifty profit, and your total return is five pounds fifty. The mental arithmetic gets awkward with prices like 11/8 or 13/2, which is why many bettors now switch to decimal.
Decimal odds show you the total return per unit staked, including the stake itself. A decimal price of 6.00 means six pounds back for every one pound wagered — five pounds profit plus the original pound. Converting from fractional to decimal is straightforward: divide the first number by the second and add one. So 5/1 becomes (5 / 1) + 1 = 6.00. And 9/2 becomes (9 / 2) + 1 = 5.50. The beauty of decimal is that comparing two prices takes a single glance. Which pays more: 11/8 or 6/4? In fractional form you need to think about it. In decimal, they are 2.375 and 2.50 — the second is clearly better.
American odds, also called moneyline odds, dominate the US market and appear on several international platforms. Positive numbers tell you the profit on a $100 stake: +450 means $450 profit from $100 wagered, which is the same as 9/2 or 5.50 decimal. Negative numbers tell you how much you must stake to win $100: -150 means you risk $150 to net $100 profit, equivalent to 2/3 or about 1.67 decimal. For RWC 2027, you will encounter American odds on certain aggregator sites and almost exclusively on US-facing platforms. Converting to decimal: for positive American odds, divide by 100 and add 1. For negative, divide 100 by the absolute value and add 1.
The format does not change the price. A team priced at 7/2, 4.50, or +350 is exactly the same bet at exactly the same value. What changes is how quickly you can compare. I work almost exclusively in decimal now because it makes spotting tiny price differences between bookmakers effortless — and those tiny differences add up across a six-week tournament with 52 matches.
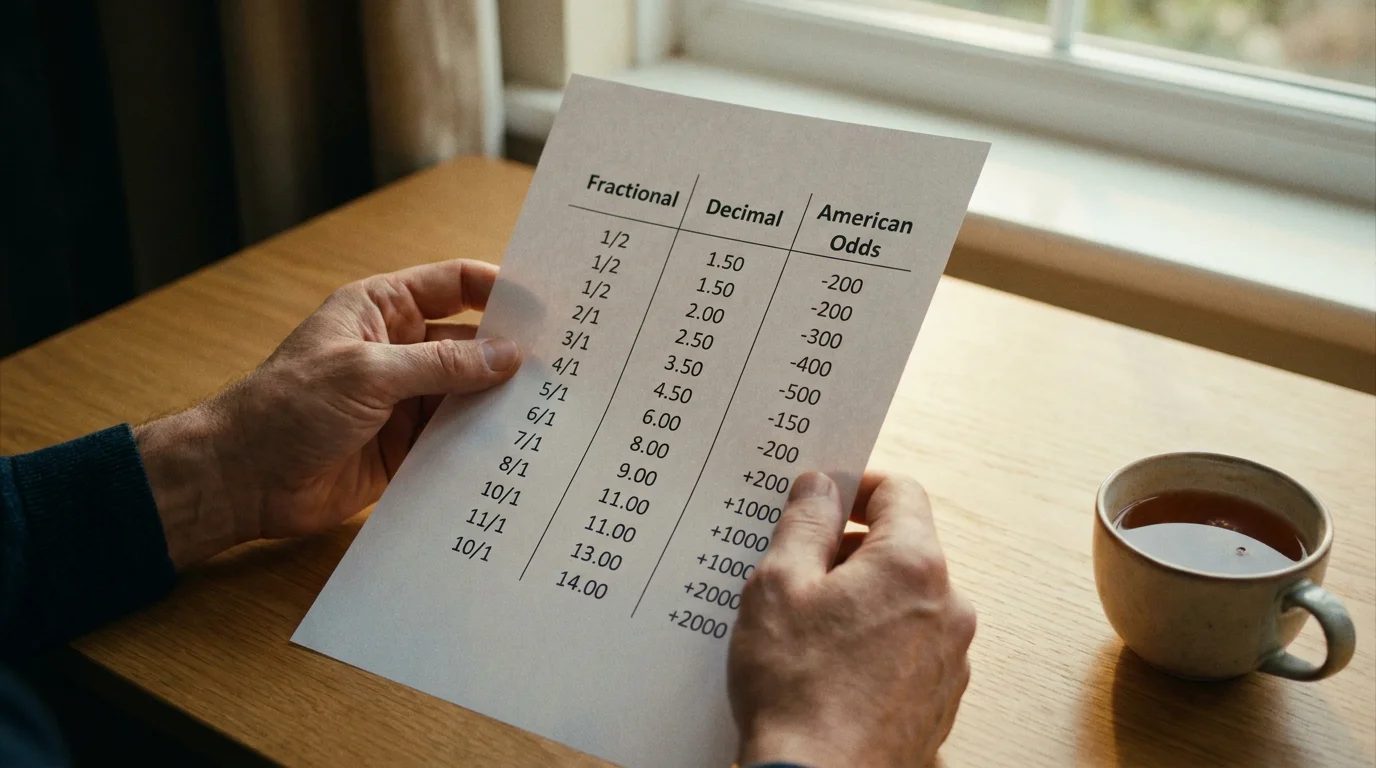
One practical note: when you see “evens” in fractional, that is 1/1, or 2.00 decimal, or +100 American. It means the bookmaker considers the outcome roughly a coin flip — after their margin is baked in, which brings us to the next section.
Implied Probability and the Bookmaker’s Edge
Here is a question I ask anyone who tells me they “understand odds”: if a bookmaker prices New Zealand at 3.50 to win the Webb Ellis Cup, what probability is the market assigning to that outcome? Most people pause. Some guess. Very few can do the arithmetic on the spot — and that single calculation is the foundation of every profitable bet I have ever placed.
Implied probability is the percentage chance embedded in a decimal price. The formula is simple: divide 1 by the decimal odds, then multiply by 100. At 3.50, implied probability = (1 / 3.50) x 100 = 28.57%. The market is saying New Zealand have roughly a 28.6% chance of lifting the trophy. At 5.00, the implied probability drops to 20%. At 1.80, it rises to 55.6%. Every price you see on a bet slip is a probability statement in disguise.
The catch is that if you add up the implied probabilities of every selection in a market, the total will exceed 100%. That surplus is the overround — the bookmaker’s built-in margin. In a three-way match result market (home, draw, away), you might see implied probabilities that sum to 107%. That extra 7% is the “vig” or “juice” — it guarantees the bookmaker a theoretical profit regardless of the outcome. For outright RWC winner markets, where you have 24 teams priced up, the overround can balloon to 130% or higher. The larger the field, the more margin is hidden in each individual price.
Understanding overround changes the way you read a market. When a bookmaker prices South Africa at 3.00 (implied 33.3%) and their actual chance is closer to 30%, the overround has inflated the price in your favour — that is a potential value bet. When the same bookmaker prices a tier-two nation at 101.00 (implied 0.99%) and the true chance is closer to 0.5%, the overround has swallowed any value — you are paying for the privilege of a long shot that is even longer than it looks.
This is not abstract theory. Rugby betting volume through Sportradar’s trading platform tripled between 2019 and 2023, and Alex Amon, Sportradar’s VP of Trading, has pointed out that the old industry assumption — that rugby is not really a betting sport — no longer holds. More volume means tighter markets on headline events, but it also means bookmakers are still learning how to price the deeper rugby markets. Props, alternative handicaps, try scorer exotics — these attract less money, which means less efficient pricing, which means more opportunities if you can calculate implied probability faster than the crowd.
To strip the overround from a price and find the “true” implied probability, divide each selection’s implied probability by the total overround. If the overround is 110%, and a team’s raw implied probability is 22%, the adjusted probability is 22 / 110 = 20%. That 20% is closer to the bookmaker’s genuine assessment. Comparing that adjusted figure against your own analysis is where edge lives.
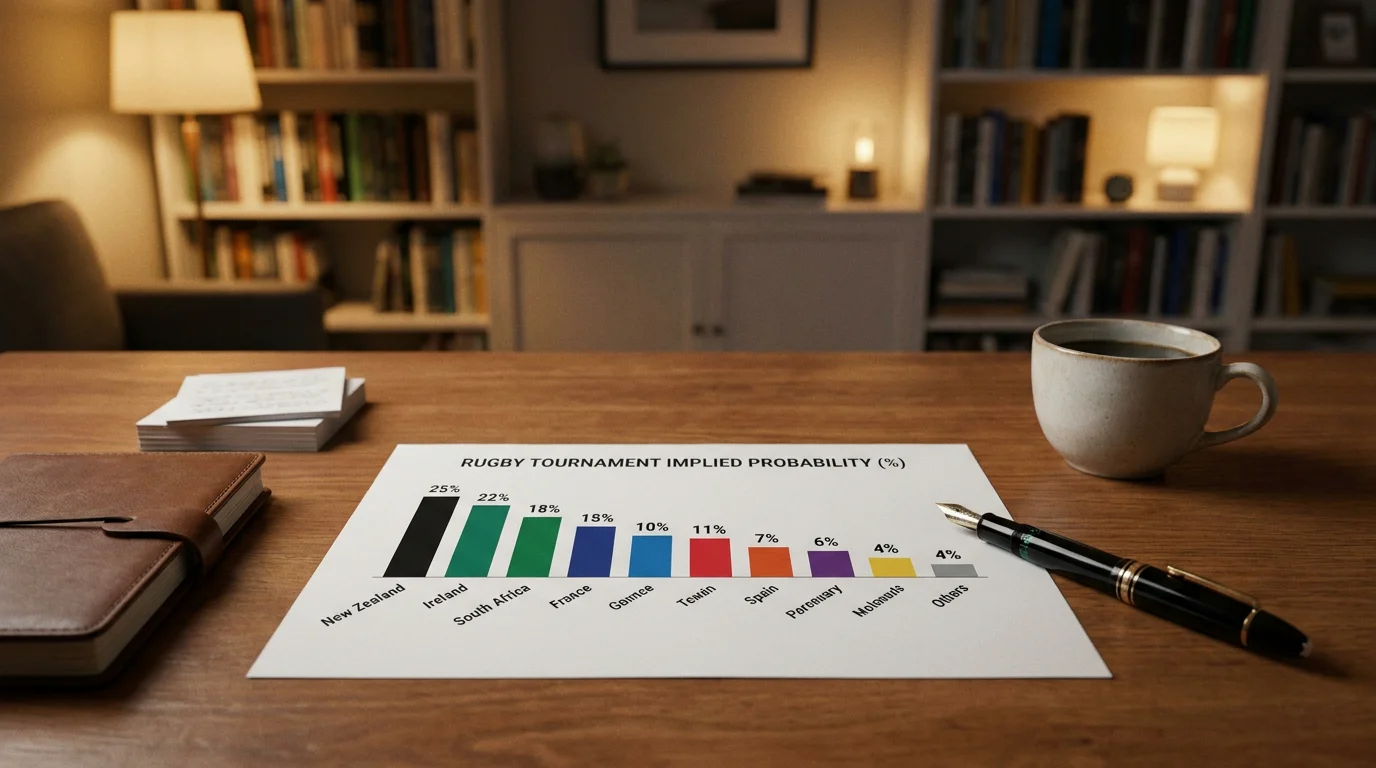
I run this calculation on every outright market I look at and on most match handicaps. It takes about thirty seconds with a spreadsheet and it is the most reliable way to separate signal from noise in Rugby World Cup winner odds.
Why Rugby World Cup Odds Move — and When to Pay Attention
In the summer before RWC 2023, New Zealand were the outright favourites on most boards. Then came a dismal run: losses to South Africa and Argentina in the Rugby Championship, unconvincing warm-up performances, question marks around the coaching setup. By the time the tournament opened in France, the All Blacks had drifted from around 3.50 to 5.00 on several platforms. They still made the final. Anyone who backed them at the drift price collected significantly more than those who jumped in early. That sequence — drift, doubt, deep run — repeats in some form at every RWC, and understanding why odds move is the key to exploiting it.
Odds shift because new information enters the market. In rugby, the most common drivers are injury announcements, squad selections, and results in the lead-up competitions. The Six Nations and The Rugby Championship function as a live form guide that bookmakers watch match by match. Turnover on Six Nations betting grew 50% in the 2022/23 season compared to the previous cycle, while the United Rugby Championship saw a 57% surge and the English Premiership rose 30%. That kind of volume means every result feeds directly into RWC pricing models — a dominant Six Nations Grand Slam by Ireland compresses their outright odds, while a poor Championship campaign by Australia pushes them out.
Pool draw announcements create another wave of movement. When the draw places two strong sides in the same group, the market recalculates their knockout-stage probability. A “pool of death” scenario — say, France and Ireland drawn together — would lengthen both teams’ outright prices because one of them is guaranteed to face a harder path from the quarter-finals onward. Smart bettors monitor pool draw dates and place positions before the draw is announced, hedging on the likely range of outcomes.
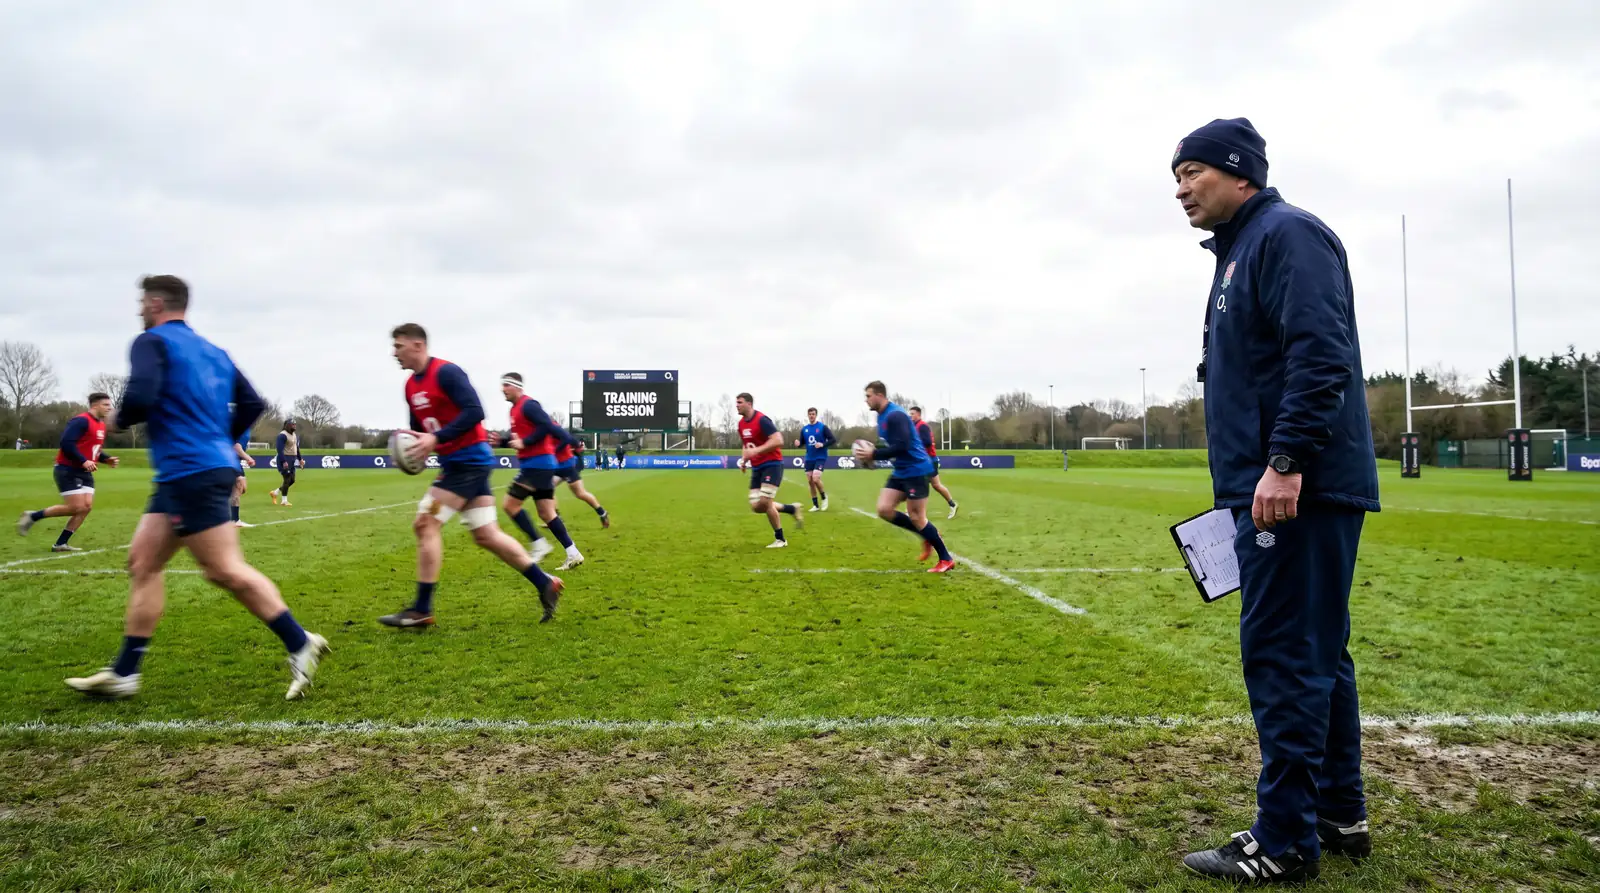
Team selection is the sharpest trigger. When a head coach names a first-choice XV for a warm-up match and the star fly-half is missing, the handicap line for the next Test will shift within minutes. For the RWC itself, squads are submitted weeks before the opener, and the omission or inclusion of key players can move outright markets by several ticks. I keep a running tracker of every squad announcement and cross-reference it against the implied probability of the outright market. If a team’s odds lengthen by 10% on the back of one injury, but my analysis says the replacement is only marginally worse, the drift has created a potential value window.
Weather and venue conditions matter more in rugby than in most sports. A forecast of heavy rain at a Sydney pool match shifts the over/under line downward and can also affect the handicap if one team’s game plan relies on expansive running rugby. Conditions in Australia in October and November vary dramatically — cool and wet in Melbourne, warm and dry in Brisbane — and the market does not always adjust quickly enough.
The broader lesson: odds are not fixed labels. They are a living consensus that updates with every new data point. The punter who tracks these inputs — form, fitness, draw, weather — and compares them against the current price has a structural advantage over the one who checks the outright board once and forgets about it until kick-off.
Comparing Odds Across Bookmakers — the Price Shopping Habit
I once calculated the difference in profit across a full RWC cycle — 48 matches at the time — between always taking the first price I saw and consistently shopping for the best available price. The gap was just over 11% on total returns. That is not a theoretical exercise. It is the difference between a breakeven tournament and a profitable one, and it costs nothing except a few extra minutes per bet.
Every licensed bookmaker sets its own prices. Two operators might agree that South Africa are favourites to beat Scotland, but one offers 1.22 and the other 1.25. On a ten-pound stake, the difference in profit is thirty pence. Trivial in isolation — but compound it across hundreds of selections over a six-week tournament and you are looking at a material improvement in overall yield. Professional bettors treat price comparison as non-negotiable. Recreational bettors treat it as optional. The maths does not care about your motivation.
Odds aggregator sites display prices from multiple bookmakers side by side. They are the fastest way to identify the best available price for any market. For outright bets placed months in advance, price discrepancies between operators can be substantial — half a point or more in decimal terms — because each bookmaker uses a different model, carries different liability from existing bets, and targets a different overround. For match-day markets, spreads tighten but rarely disappear entirely.
The live and in-play segment adds another dimension. The global in-play betting market reached $22.9 billion in 2024 and is projected to nearly double to $47.5 billion by 2030, growing at a compound annual rate of 13%. Europe accounts for the largest share of that revenue, and rugby — with its frequent scoring events, sin bins, and momentum swings — is particularly well suited to live markets. During a match, odds can diverge sharply between operators because each feeds off different latency models and risk tolerances. If you have accounts with three or four bookmakers and can switch between them quickly, you will consistently capture better in-play prices than someone locked into a single platform.

A practical note on logistics: maintaining multiple accounts is entirely legal in the UK and is actively encouraged by the competitive structure of the market. Each account takes a few minutes to open and verify. I typically have four or five active for any major tournament — not because I enjoy the admin, but because the numbers demand it.
There is one caveat. Some operators restrict or limit accounts that consistently take the best price and win. This practice, often called “gubbing”, is a reality of the UK market. If you find an account restricted, it is frustrating but it is also a backhanded compliment — it means you were extracting genuine value. The response is not to stop shopping; it is to maintain enough accounts that the loss of one does not cripple your strategy.

Finding Value — When the Odds Are Wrong in Your Favour
Every punter has a story about backing a long shot that came in. Fewer have a story about consistently finding bets where the odds understate the true probability — and that distinction separates gambling from investing. Value is the gap between what the market says and what the data supports, and it is the only concept that produces a positive expected return over time.
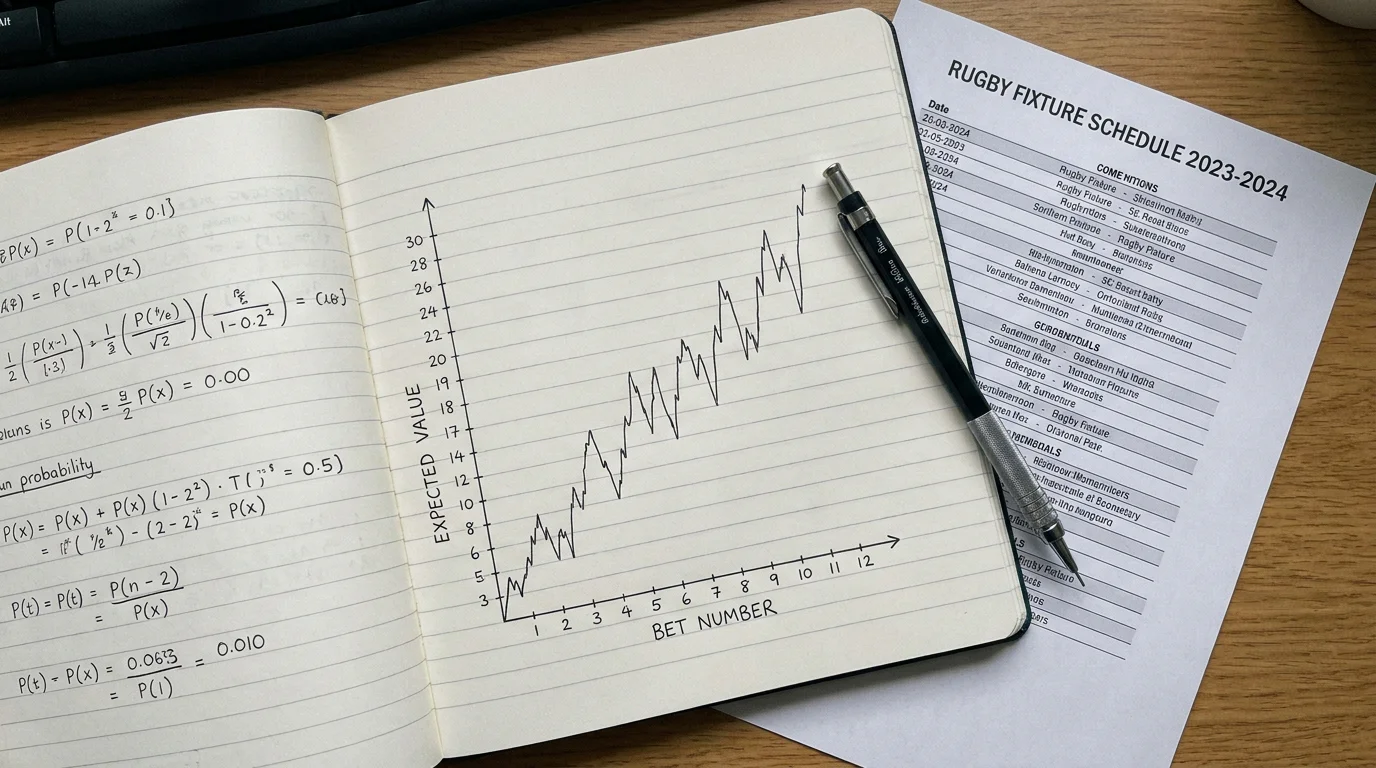
Expected value — EV — is the mathematical expression of that gap. The formula is: (your estimated probability x potential profit) minus ((1 minus your estimated probability) x stake). If you believe Ireland have a 30% chance of winning the Webb Ellis Cup and the decimal price is 4.50, the EV on a one-pound bet is (0.30 x 3.50) minus (0.70 x 1.00) = 1.05 minus 0.70 = +0.35. A positive EV means the bet is mathematically worthwhile over the long run, regardless of whether this particular bet wins or loses. A negative EV means the price is too short for the probability — the bookmaker has you beaten before kick-off.
The hard part is estimating “your probability” with any rigour. I use a blend of inputs: current World Rankings, recent head-to-head records, tries scored and conceded per match over the previous 12 months, set-piece efficiency, and a subjective adjustment for coaching quality and squad depth. None of these inputs is perfect, but combining them produces an estimate that is more accurate than gut feeling and — critically — more accurate than the market in specific spots.
Where does value tend to hide at a Rugby World Cup? In my experience, three areas are most productive. First, pool-stage matches between a tier-one side and a newly qualified team. The market often sets the handicap line wide enough that the favourite’s price looks unattractive, but the match result market — simply backing the favourite to win — can offer a small overlay because the draw price is artificially compressed. Second, quarter-final match-ups where the market fixates on world ranking and underweights recent form. A team peaking at the right moment can be five or six ticks longer than it should be. Third, the each-way outright market, where a semi-finalist priced at 10.00 or higher offers quarter-odds for a top-four finish — essentially a value bet on reaching the last four rather than winning the whole thing.
The discipline required is patience. Positive-EV bets do not announce themselves. They emerge from the routine work of running implied-probability calculations against your own model, day after day, market after market. Most of the time the conclusion is “no edge here, move on”. That is fine. The whole point is to bet only when the numbers say yes, not when the excitement of the tournament says yes.
I will be honest: I skip more RWC bets than I take. That restraint is the strategy.
What do fractional odds of 5/1 mean for a Rugby World Cup outright bet?
Fractional odds of 5/1 mean you receive five pounds of profit for every one pound staked, plus your original stake back. So a ten-pound outright bet on a team at 5/1 returns sixty pounds in total if that team wins the Webb Ellis Cup — fifty pounds profit and your ten-pound stake. In decimal terms, 5/1 is the same as 6.00. The implied probability is 16.7%, meaning the market considers it roughly a one-in-six chance.
Why do rugby world cup odds change before the tournament starts?
Odds shift because new information enters the market. The main triggers are results in lead-up competitions such as the Six Nations and The Rugby Championship, injury and squad announcements, pool draw outcomes, and the weight of money placed by other bettors. A strong Six Nations campaign can shorten a team’s outright price, while a key injury can push it out significantly. Odds are a living reflection of the market’s current assessment, not a fixed prediction.
What is overround and how does it affect my RWC payout?
Overround is the bookmaker’s built-in margin. If you convert every selection’s odds to an implied probability and add them up, the total exceeds 100%. That surplus — typically 5-10% on match markets and 20-30% on large outright fields — is the overround. It means every price you see is slightly shorter than the ‘true’ probability warrants. The higher the overround, the worse the value for the bettor. Comparing overround across bookmakers helps you identify who is offering the tightest margins on RWC markets.
Should I bet at the earliest odds or wait closer to the Rugby World Cup?
Neither approach is universally better — it depends on the information landscape. Early odds, sometimes called ante-post prices, are often more generous because the bookmaker is pricing under greater uncertainty. If you have a strong view on a team’s chances and the price looks long relative to your assessment, locking in early captures that value. The risk is that injuries, form slumps, or an unfavourable pool draw can erode the position before the tournament starts. Waiting brings more certainty but usually shorter prices. I tend to take a partial position early and adjust closer to kick-off.
