
 Available in US
Content
- Match Result and Draw No Bet — Where Most Punters Start
- Handicap Betting — Levelling the Field in Lopsided RWC Fixtures
- Over/Under Totals — Betting on Points, Not Winners
- Try Scorer Markets — First, Anytime and Last
- Outright and Futures — the Long Game Before Kick-Off
- Specials and Player Props — the Expanding Frontier

The first rugby bet I ever placed was a match result — England to beat Italy, odds-on, Six Nations, sometime around 2009. It won. I collected a few quid and thought I understood rugby betting. What I actually understood was the most basic market in a sport that offers dozens. The global rugby betting market generates approximately $8.26 billion annually — about 5% of the worldwide sports betting total — and the range of wager types available for a Rugby World Cup match in 2027 is broader than at any point in the sport’s betting history.
This guide breaks down every major market you will encounter during RWC 2027: from the straightforward match result through handicaps, totals, try scorers, outrights and into the expanding world of player props and specials. For each one, I explain what you are actually betting on, where the analytical edge tends to sit, and the specific features that make rugby betting markets explained in practical terms rather than textbook definitions. If you have placed a few match bets and want to understand what else is on the menu, start here.
Match Result and Draw No Bet — Where Most Punters Start
There is a reason match result is the most popular rugby market: it is the simplest question in sport. Who wins? Pick a side, place a stake, watch the game. About 60% of all betting volume on rugby sits in the match outcome category, which includes standard 1X2 (home/draw/away) and draw no bet.
The 1X2 market gives you three options. Back the home team, back the draw, or back the away team. Your selection needs to be correct at full time, including any extra time in knockout matches where applicable. The draw is the outlier in rugby — it happens far less frequently than in football. Across the last three RWCs, draws in regulation time have occurred in fewer than 3% of all matches. That rarity means the draw price is typically very long — 26.00 or higher in most pool-stage fixtures — and it also means the bookmaker can hide significant margin in the draw line without most bettors noticing. If you add up the implied probabilities of all three outcomes, the draw’s contribution to the overround is disproportionately large.
Draw no bet removes the draw from the equation. You pick a team to win; if the match finishes level, your stake is refunded. The trade-off is shorter odds on your selection — the bookmaker removes the draw risk, and you pay for that removal through a lower price. I use draw no bet selectively, primarily in knockout matches where the possibility of extra time introduces uncertainty that the standard 1X2 market does not handle cleanly.
Where is the edge in match result markets? Not in the obvious mismatches. When South Africa face Namibia in a pool match, the match result odds on South Africa will be around 1.01 to 1.03 — there is no value there, and the risk-reward is absurd. The edge sits in competitive fixtures between teams ranked within five or six places of each other, where the market’s assessment of the probability gap is most likely to be wrong. A match between, say, Fiji and Scotland might price Scotland at 1.45 and Fiji at 2.80. If your model says Fiji’s true probability is closer to 40% than the 30% implied by 2.80, that is a value position.
One tactical note: match result markets for RWC pool games are generally priced most efficiently in the 48 hours before kick-off, once team sheets are published and the weight of money has settled. If you want to capture value, look at the market earlier — when squads are announced or when a key injury is revealed — before the price fully adjusts. The window is short, but it is real.
Handicap Betting — Levelling the Field in Lopsided RWC Fixtures
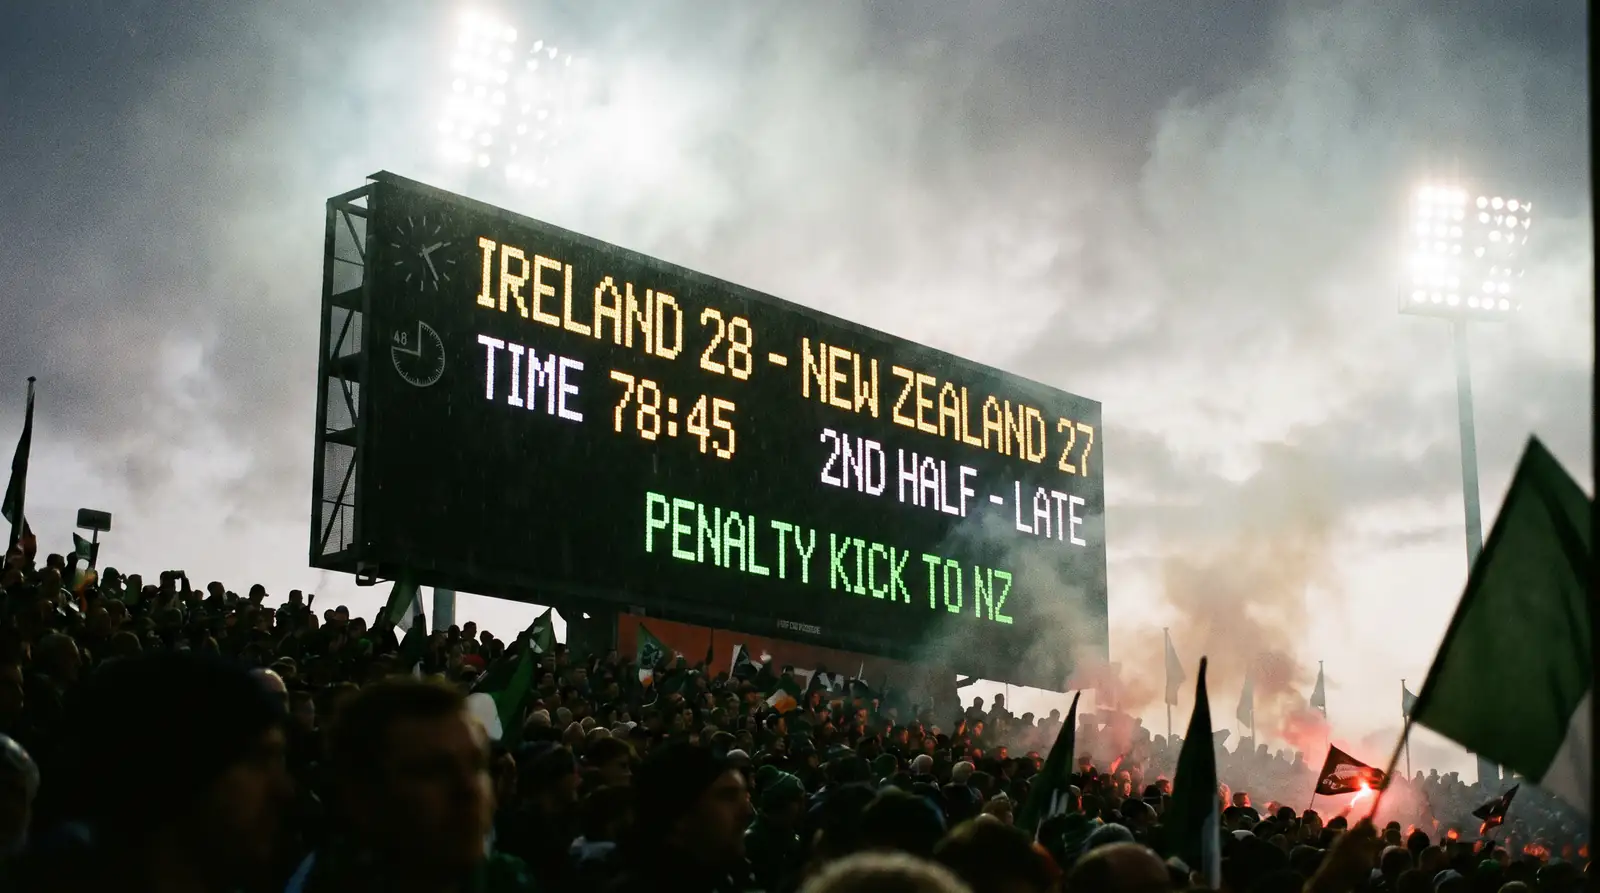
I once watched a RWC pool match where the final score was 84-7. The match result market had been utterly pointless — everyone knew who would win. But the handicap line had been set at -45.5, and whether the dominant team covered that spread was a genuinely interesting proposition. Handicap betting exists precisely for these situations: it transforms a foregone conclusion into a competitive question by applying a points advantage or disadvantage to one side.
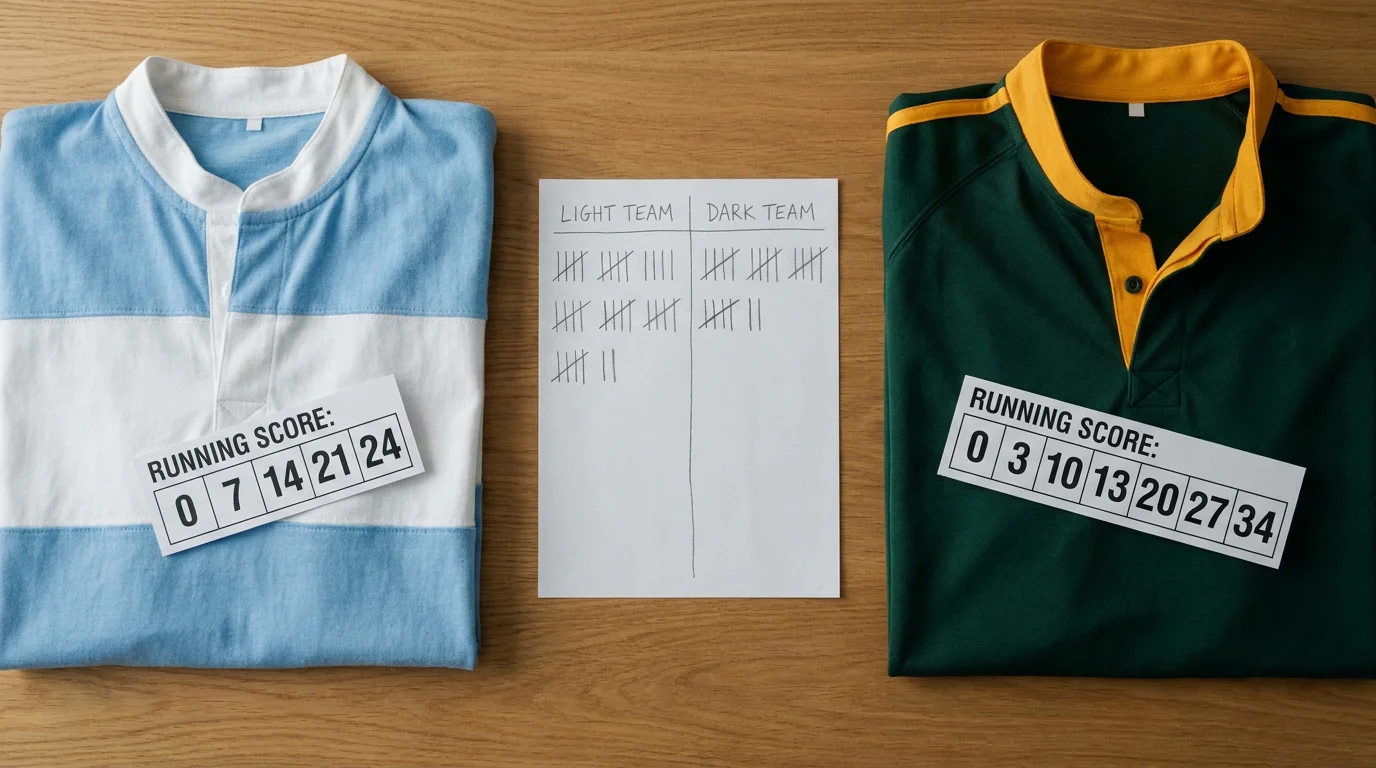
The mechanics are straightforward. If South Africa are -14.5 against Fiji, the bookmaker is saying “subtract 14.5 points from South Africa’s final score and then compare”. If SA win 28-10, the adjusted score is 13.5-10 — they have covered the handicap. If SA win 20-10, the adjusted score is 5.5-10 — they have not. The half-point eliminates the possibility of a push (a draw on the handicap), which means every bet has a definitive result.
European handicap, also called three-way handicap, uses whole numbers and includes the draw as a possible outcome. If SA are -14 and win by exactly 14 points, the handicap result is a draw, and bets on the draw win. Asian handicap splits your stake across two lines to reduce the risk of a push. For most UK bookmakers and most RWC markets, the standard offering is the half-point handicap, but alternative lines are often available — allowing you to take a smaller or larger spread at adjusted odds.
Alternative lines deserve attention. The standard handicap might be set at -21.5, but if you think the margin will be closer to 30, you can take -27.5 at a longer price. Conversely, if you think the favourite will win but not by the full spread, taking -14.5 at shorter odds gives you more margin for error. I often look at two or three alternative lines for a single match before deciding which offers the best risk-adjusted return.
For a deeper exploration of how point spreads function across different RWC fixture types — including Asian handicap mechanics and historical margin data — I have put together a full breakdown on rugby world cup handicap betting.
The key analytical input for handicap betting is points differential by opponent quality. If a team averages a 25-point winning margin against opponents ranked 10th to 20th, but the bookmaker is offering a line of -30.5 against a team ranked 15th, the data says the line is too wide. Conversely, a line of -18.5 in the same scenario might represent value on the favourite. I build my handicap model from the last 12 months of head-to-head and opponent-class data, applying a tournament adjustment of roughly 10% tighter margins — because RWC matches tend to be closer than regular Tests due to higher stakes and superior preparation by underdog teams.

Handicap markets account for the second-largest share of rugby betting volume after match result, and they are where I place the majority of my RWC match-day bets.
Over/Under Totals — Betting on Points, Not Winners
Some of my most profitable RWC bets have had nothing to do with which team won. The over/under market asks a single question: will the combined score of both teams be above or below a specified number? You do not care who crosses the try line — only how many points end up on the board.
A typical RWC pool-stage match between two tier-one sides might carry a total line of 44.5 or 47.5. A mismatch — say, New Zealand against a newly qualified team — could see the line set at 60.5 or higher. The beauty of this market is that it responds to a different set of inputs than match result or handicap. Style of play is the dominant factor. Two teams that play expansive, running rugby will produce more tries than two teams built around set-piece dominance and territorial kicking. The matchup between attacking intent and defensive structure is what drives the total.
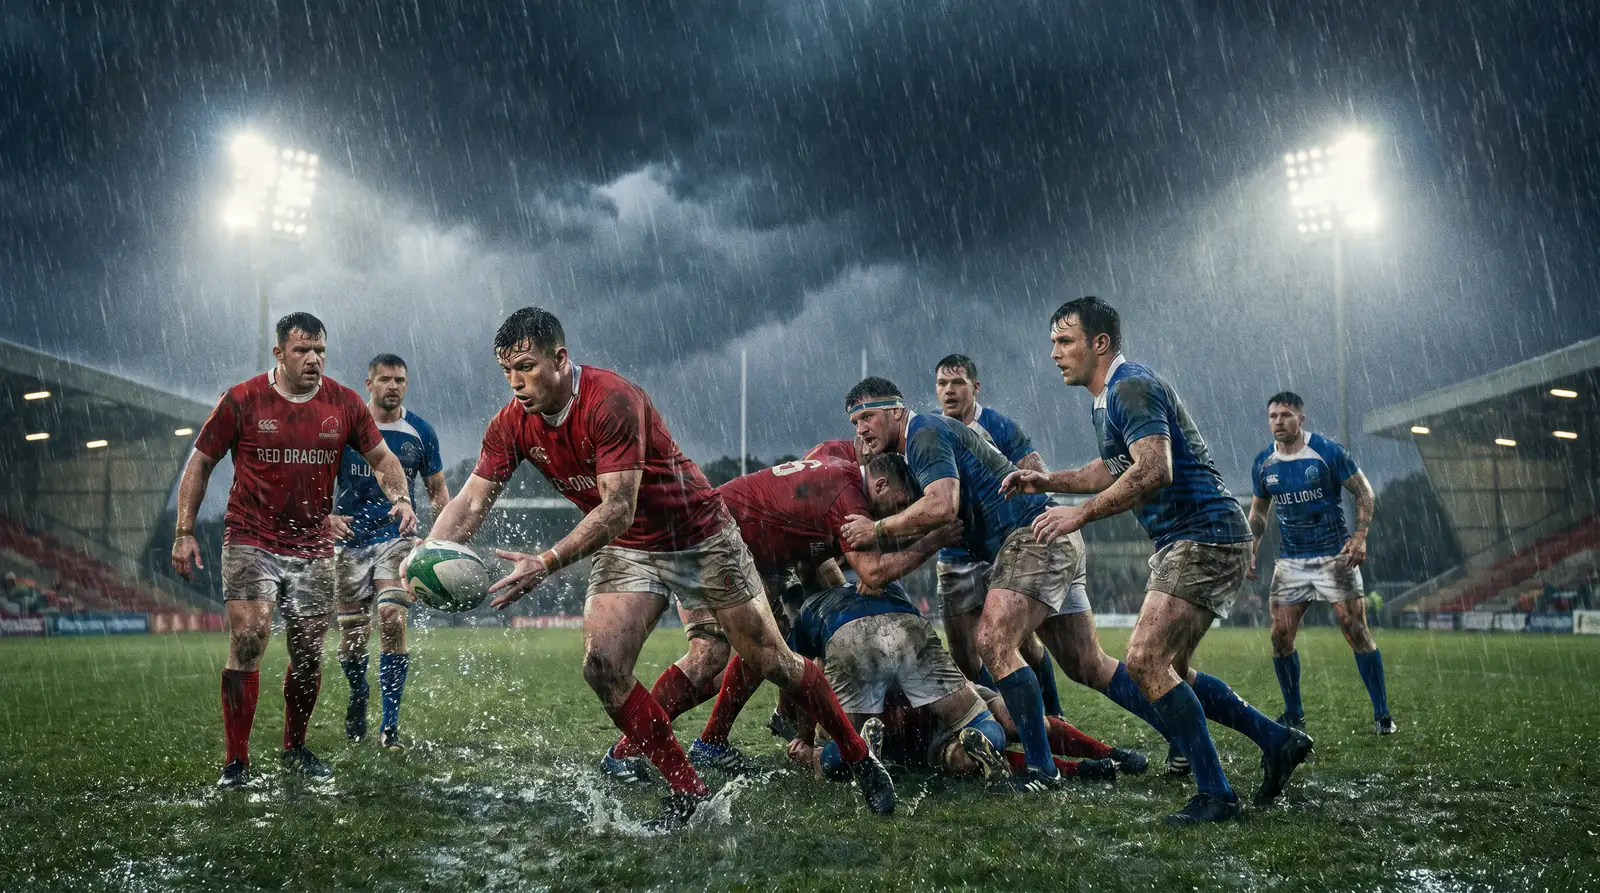
Weather deserves its own paragraph because it is so consistently undervalued in this market. Heavy rain at a Sydney pool match does not just make handling harder — it fundamentally changes the game plan. Teams kick more, maul more, and attempt fewer offloads. The try count drops, penalties increase, and the total shrinks. I track weather forecasts for every RWC venue and adjust my projected total by three to five points on the basis of rain alone. Bookmakers account for weather, but often later than the forecast appears — creating a brief window of mispricing if you act early.
Team totals are a useful alternative to the combined match total. Rather than betting on the combined score, you bet on whether one specific team will score over or under a set number. This is particularly useful in mismatches where you have a strong view on the dominant team’s attacking output but less confidence in the underdog’s ability to score. If your model says Ireland will score 40 or more against a qualifier, but you are unsure whether the qualifier will manage 7 or 14, the team total on Ireland is a cleaner expression of your analysis than the combined total.
Alternative lines work the same way as in handicap markets. If the standard total is 47.5 and you think the match will be high-scoring, you can take over 52.5 at longer odds for a bigger payout. I use alternative totals when my projected score is more than five points away from the bookmaker’s line — that gap usually signals a meaningful disagreement worth backing.
Try Scorer Markets — First, Anytime and Last
With roughly 290 million online bets placed every month across UK platforms, try scorer markets are among the most popular casual wagers. They are also among the most mispriced. The reason is simple: bookmakers set try scorer odds largely on name recognition and recent form, while the actual probability of any player scoring depends on positional data, team structure, and set-piece patterns that the headline price rarely reflects.
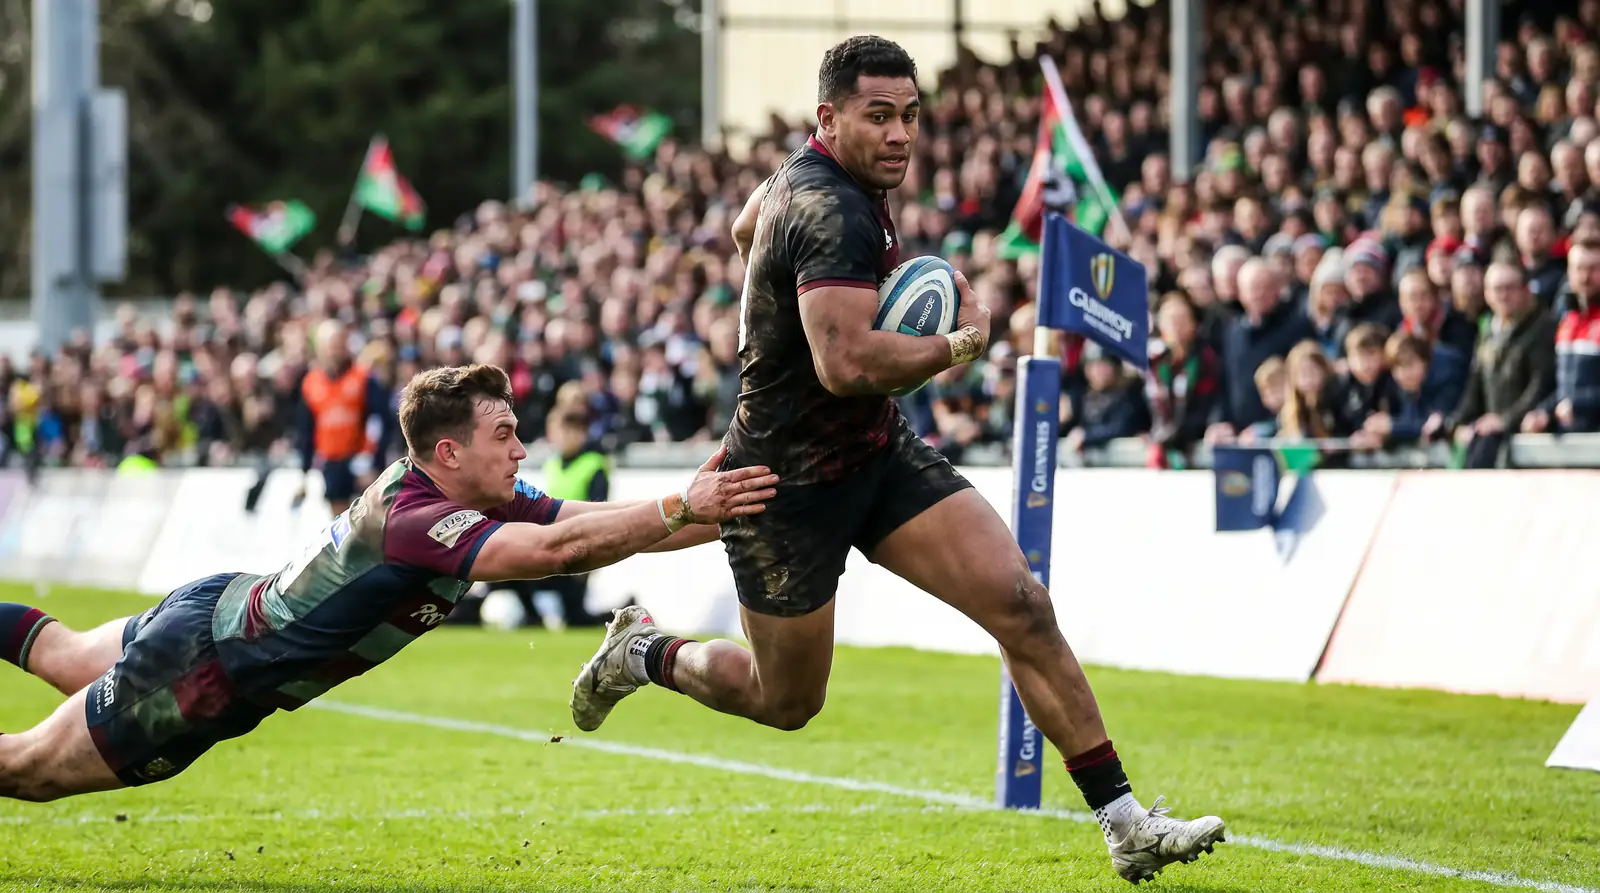
First try scorer asks which player will score the opening try of the match. It is the most volatile try scorer market because the first try is disproportionately influenced by early-game dynamics: which team kicks off, how the opposition handles the restart, and whether an early scrum or lineout near the try line creates an opportunity for a forward runner. Wingers and outside centres tend to be shortest in the market because they score the most tries overall, but the first try is often scored by a flanker or number eight who finishes off a close-range driving maul. I track first-try distribution by position from the previous 12 months of international rugby and compare it against the bookmaker’s pricing. When the market underweights forwards, the edge is there.
Anytime try scorer is a more forgiving bet — your player just needs to cross the line at any point during the match. The odds are shorter than first try scorer because the probability is higher, but the market inefficiencies are similar. Wingers and full-backs dominate the short end of the market; back-row forwards and hookers are often underpriced. At the RWC specifically, where set-piece tries account for a higher proportion of total tries than in club rugby, the forward positions deserve more attention than the market gives them.
Last try scorer is the least popular of the three and, consequently, the least efficiently priced. The final try of a match is heavily influenced by game state: if one team is chasing the game in the closing minutes, their attack becomes more desperate and the opposition’s defence tires. Bench players who come on in the second half — particularly impact forwards and replacement backs — are systematically underpriced in the last try scorer market because bookmakers weight starting XVs more heavily.
The analytical framework for try scorer markets differs from match-level betting. Instead of team-wide metrics, you need player-level data: carries per game, carries inside the opposition 22, clean breaks, involvement in lineout mauls, and historical try-scoring rate. Combining these into a per-match try probability for each player and comparing it against the bookmaker’s implied probability is the process. It is time-consuming but rewarding — try scorer markets are where recreational bettors overpay and analytical bettors profit.
Outright and Futures — the Long Game Before Kick-Off
Outright markets are the headline markets of any RWC — the ones that appear in newspaper columns and pub conversations. Who will win the Webb Ellis Cup? Who will be the tournament’s top try scorer? Who will top each pool? These bets are placed well in advance, sometimes 12 or 18 months before the first ball is kicked, and they tie up your stake for the duration.
Tournament winner is the flagship. The outright market prices every participating nation from shortest (typically South Africa or New Zealand) to longest (the newly qualified sides at 500.00 or higher). The market moves constantly in response to form, fitness, and draw implications. Each-way terms apply on most platforms, typically paying a quarter or a fifth of the odds for a top-two or top-four finish. Each-way outright is one of the most underappreciated angles in RWC betting — backing a team at 12.00 each-way means you profit handsomely if they reach the final, even if they lose it.
Top try scorer is a futures market that rewards knowledge of attacking players and their team’s style of play. The market opens months before the tournament, with wingers from the highest-scoring nations typically shortest. The pricing rarely accounts for potential injury, rotation, or the number of matches each team will play — a team eliminated in the pool stage gives its players three matches, while a finalist’s players get up to seven. I adjust for expected matches played, which often shifts the value toward players from teams most likely to reach the semi-finals rather than those with the highest per-match try rate.
Top points scorer follows similar logic but is more predictable because fly-halves and full-backs who handle goal-kicking duties accumulate points through penalties and conversions as well as tries. A reliable goal-kicker on a dominant team — one that scores frequently and wins by large margins — has a structural advantage in this market. The volatility is lower than top try scorer, and the market tends to be more efficient, but occasional mispricing appears when a team changes its designated kicker or when a fly-half returns from injury mid-tournament.

Group winner and qualification markets round out the futures category. These are straightforward — pick which team tops each pool or which teams qualify from each group — and they respond sharply to the pool draw. I use them as hedging instruments: if my outright position on a team is looking exposed after a pool-stage loss, backing a rival to top the group can limit the downside.
Specials and Player Props — the Expanding Frontier
Five years ago, if someone told me I would be placing a bet on the number of tackles a specific flanker makes in a RWC quarter-final, I would have laughed. Player props were a niche curiosity in rugby, limited to a handful of markets on the biggest fixtures. That has changed dramatically. The global in-play betting market hit $22.9 billion in 2024 and is growing at 13% annually, and the expansion of live and pre-match props in rugby is a direct consequence of that growth. Bookmakers now offer individual player performance markets — tackles made, carries, metres gained, turnovers won — on most tier-one RWC fixtures.
Alex Amon of Sportradar made the point clearly: the old assumption that rugby is not a betting sport no longer reflects reality when you look at the growth in activity across its major competitions. That growth is most visible in the prop and specials category, where the market is still maturing and pricing inefficiencies are most common.
Match specials cover events within the game that do not relate to the final score. Will there be a red card? Will a player be sent to the sin bin? Will the first scoring play be a penalty, try, or drop goal? Will the match go to extra time? These markets are priced on historical base rates and adjusted for the specific matchup. The red card market, for example, is almost always underpriced in high-intensity rivalries — England versus Argentina, South Africa versus New Zealand — where the historical card rate is significantly higher than the baseline. I track card rates by referee as well as by matchup, because some officials are demonstrably more card-happy than others at World Cups.
Player performance props require the most granular data. A bet on “over 12.5 tackles” for a blindside flanker is essentially a bet on two things: the team’s defensive workload (how often the opposition carries the ball into their channel) and the individual’s tackle rate within that workload. I model this by combining the opposition’s carries per match with the target player’s tackle-per-game average, adjusted for the defensive system the team employs. If the model projects 15 tackles and the bookmaker has set the line at 12.5, the over looks strong.
The risk with props is variance. A player can be substituted in the 55th minute and miss the entire period where he would have accumulated the stats your bet needs. Injury, tactical substitution, and sin binning are all threats. I limit my prop bets to players with high expected minutes — typically 70 or more — and avoid props on positions with frequent rotation, such as hooker or tighthead prop, where strategic substitution is standard in the second half.
What is the safest type of bet for a Rugby World Cup match?
Match result on a strong favourite is the lowest-variance option, but ‘safest’ and ‘best value’ are not the same thing. Odds-on favourites win most of the time but offer thin returns relative to the stake risked. Draw no bet provides a middle ground: you back a team to win, and if the match ends level, your stake is returned. For most recreational punters, single match result bets on competitive fixtures offer the best balance between simplicity and reasonable odds.
How do rugby handicap lines differ from football handicaps?
The core mechanic is identical — a points advantage or disadvantage applied to one team before the result is determined. The difference is magnitude. Rugby scores are larger and more variable than football scores, so handicap lines routinely sit at 14.5, 21.5, or even 40+ points for mismatches. Football handicaps rarely exceed 2.5 goals. The wider range in rugby means there is more room for the bookmaker to set the line imprecisely, which creates more opportunities for bettors who model margins accurately.
Can I combine different rugby market types in one accumulator?
Yes. Most UK bookmakers allow you to combine match result, handicap, over/under and try scorer selections from different matches into a single accumulator. You cannot usually combine multiple selections from the same match — for example, match result and handicap on the same fixture — because those outcomes are correlated. The risk of multi-market accumulators is complexity: each additional leg compounds the probability of losing, so keeping selections to four or fewer legs is a sensible discipline.
Are player prop markets available for all Rugby World Cup matches?
Player props — tackles made, carries, metres gained — are typically available for tier-one versus tier-one fixtures and high-profile pool matches. Smaller pool games between lower-ranked sides may only offer basic markets such as match result, handicap, and over/under. The availability expands as the tournament progresses: quarter-finals, semi-finals, and the final carry the widest range of player prop markets. In-play player props are less common in rugby than in sports like basketball, but the selection is growing each tournament cycle.
