
 Available in US
Content

Search “rugby world cup betting tips” and you will drown in the same advice recycled across a dozen sites: research the teams, check recent form, consider the weather. None of it is wrong, exactly — it is just useless. Telling someone to “research the teams” before betting on the RWC is like telling a pilot to “look at the instruments” before landing. The question is which instruments, when, and what the readings actually mean.
I have been modelling Rugby World Cup outcomes since 2015, and the single biggest lesson from that decade is that profitable rugby world cup betting tips are not tips at all — they are frameworks. A tip says “back South Africa at 3.00”. A framework says “here is how to evaluate whether 3.00 is a price worth taking, and here is how to size the stake if it is”. This guide is the framework.
The data supports the approach. Roughly 5% of all bettors engage with rugby markets, and match outcome wagers account for about 60% of the total volume on the sport. That tells you the majority of rugby punters are concentrated in the most straightforward market, often without going deeper into the numbers that drive match outcomes. The remaining 40% of volume is spread across handicaps, totals, try scorers and specials — markets where analytical edges are wider because fewer eyes are on them.
RWC 2027 offers 52 matches across six weeks. That is not a sprint; it is a campaign. Treating it as a series of isolated punts is the fastest way to bleed your bankroll. Treating it as a structured project — with defined metrics, clear market selection criteria, and disciplined staking — is how you emerge in profit. Everything that follows is designed to give you that structure.
The Numbers That Actually Predict Rugby World Cup Results
During the 2022/23 season, betting turnover on the Six Nations jumped 50%, the United Rugby Championship surged 57%, and the English Premiership grew 30%. That explosion in volume did not happen because punters suddenly fell in love with rugby — it happened because data became more accessible, models became more refined, and the market started rewarding people who could read a stat sheet rather than a hype cycle. The same principle applies to the World Cup, only amplified by the stakes.
Win percentage over the previous 12 months is the starting point, but it is a blunt tool on its own. A team that has beaten Fiji, Tonga and Uruguay five times each looks great on paper and tells you nothing about how they will fare against South Africa. I weight wins by opponent quality using World Rankings at the time of each match, which produces an adjusted win rate that correlates far more strongly with RWC knockout performance than raw results do.
Points differential — the gap between points scored and points conceded — is more predictive than win percentage in tournament rugby. A side that wins most of its games by three points is fundamentally different from one that wins by twenty. At a World Cup, the margin matters because it reflects how teams perform under pressure. Tight wins suggest a team that grinds but can be caught; large margins suggest dominance or, sometimes, weak opposition. I track points differential as a per-match average and split it into home and away figures, since many teams perform markedly better in their own stadium.
Tries scored and conceded per match is the metric that separates attacking intent from defensive structure. At RWC 2023, the tournament averaged 6.8 tries per game. Teams that consistently scored above that average in the build-up — New Zealand, Ireland, France — all reached the quarter-finals. Teams below it faced early elimination or unconvincing pool-stage campaigns. I use a 12-month rolling average of tries per match, broken down by half, because second-half try-scoring correlates with squad depth and fitness — both critical at a six-week tournament.
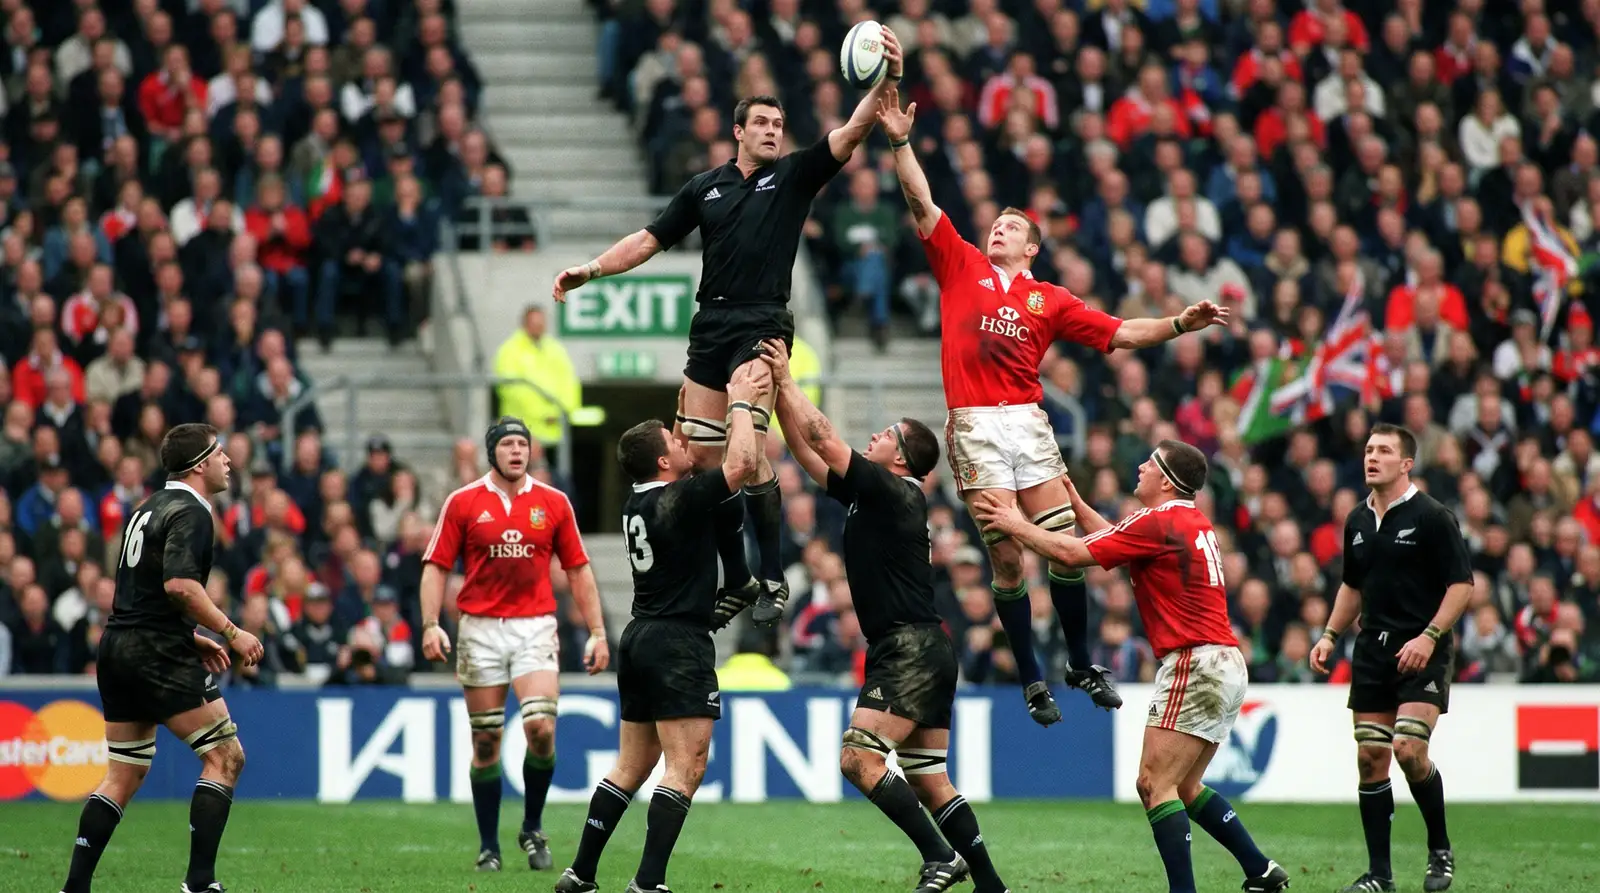
Set-piece efficiency rarely makes the betting headlines, but it should. Lineout and scrum performance directly affects territory and possession, which in turn determines scoring opportunities. A team that loses 25% of its own lineout ball concedes field position on every restart. I track lineout win percentage, scrum penalty ratio, and maul tries as a combined set-piece index. When this index diverges sharply from the market price, it usually signals an undervalued or overvalued team.
Discipline rounds out the core metrics. Penalties conceded per match, yellow cards per tournament, and red card history all feed into match handicap analysis. A team that averages 12 penalties conceded per game is handing the opposition territory and often three points at a time. At the RWC, referees enforce the laws more stringently than in regional competitions, so teams with borderline discipline records tend to get punished more harshly. I apply a 1.2x inflation factor to penalty-conceded averages when modelling World Cup matches — it is crude but effective.
None of these metrics works in isolation. The value is in combining them into a composite rating, comparing that rating against the market’s implied probability, and acting only when the gap is wide enough to justify the risk.

Historical Patterns Every RWC Punter Should Know
The first Rugby World Cup in 1987 was won by the hosts, New Zealand. Since then, only one host nation has lifted the trophy — and that was New Zealand again, in 2011. South Africa have won it three times, always away from home. England won in Sydney. The pattern is clear: hosting a World Cup provides atmosphere and crowd support, but it does not reliably translate to the final result. Bettors who overweight home advantage in outright markets routinely overpay for the host nation.
Southern Hemisphere dominance in finals is another persistent trend. Of the ten RWC finals played through 2023, eight featured at least one Southern Hemisphere team, and all four winners since 2003 have been from the south — South Africa three times and New Zealand once. The sole Northern Hemisphere winner remains England in 2003. I do not treat this as a law of nature, but I do account for it when building outright models. Northern Hemisphere sides that dominate the Six Nations do not always replicate that form under the specific pressures of a World Cup knockout stage.
Pool-stage upsets are rarer than the narrative suggests but impactful when they occur. Japan’s 34-32 win over South Africa in 2015 is the most famous example, and it moved outright and group-winner markets dramatically within minutes. At RWC 2023, over 2.4 million spectators attended matches across France, with 325 tries scored in 48 games — a high-scoring tournament by historical standards that rewarded bettors who backed the over in pool matches between mismatched teams. The real opportunity in upsets is not predicting them — it is positioning yourself to profit from the market overreaction that follows.
The expansion from 20 to 24 teams changes the historical template significantly. RWC 2027 will feature 52 matches, up from 48, with a new Round of 16 between the pool stage and the quarter-finals. Alan Gilpin, World Rugby’s Chief Executive, framed the decision as delivering a more compact tournament with six pools of four teams feeding into a knockout phase with more high-stakes content. For bettors, that means four additional knockout matches — each one a separate market with its own handicap, total, and try scorer lines. It also means the pool stage becomes more forgiving: with only three group games, a single loss does not necessarily eliminate a team, which compresses the odds on “pool of death” scenarios.
Rest days between matches have historically influenced results more than most models account for. At RWC 2023, teams with five or fewer days’ rest before a knockout match had a losing record against opponents with six or more days. Scheduling is published well in advance, which means you can identify potential fatigue edges before the bookmakers fully price them in — particularly in the early rounds of the knockout stage when turnaround times are tightest.
The through-line across all these patterns is the same: tournament rugby operates on different dynamics than regular international windows. Teams peak, fatigue accumulates, refereeing standards tighten, and the pressure of sudden elimination magnifies small edges. A model built on Test-match data alone will miss these tournament-specific effects. Adjusting for them is what separates profitable RWC analysis from generic form reading.
Matching the Right Market to the Right Data
Not every market suits every analysis. I learned this the hard way during RWC 2019 when I spent hours building a model for match results and then tried to apply the same logic to first try scorer bets. The model was predicting which team would win; the try scorer market needed me to predict which individual would cross the line first. Completely different data inputs, completely different edge profile. The market you choose should follow from the type of data you trust most, not from what looks exciting on the bet slip.
Outright markets reward long-term strategic thinking. If your strength is evaluating squad depth, coaching quality, and historical tournament trajectory, the outright winner or top-four finish markets are your domain. These bets are placed weeks or months before kick-off and are influenced by macro factors — the draw, injury lists, form cycles — rather than match-day specifics. The disadvantage is illiquidity: your capital is locked until the tournament ends or you cash out at a worse price.
Match handicap is the market where game-level data pays the highest dividend. If you can model points differential, set-piece efficiency, and discipline more accurately than the bookmaker, handicap lines are where that edge materialises. The key is specificity: a generic model says “Ireland are better than Samoa” — everyone knows that. A handicap-grade model says “Ireland’s second-half try-scoring rate against tier-two opposition over the past two years implies a margin of 28 to 34 points, and the bookmaker has set the line at -25.5”. That granularity turns an obvious mismatch into a quantified position.
Over/under totals respond best to style-of-play analysis and environmental factors. Two teams with run-heavy, high-tempo game plans facing each other in dry conditions will produce a different total than two forward-dominant, territory-kicking sides playing in rain. I model expected match totals by combining each team’s average points scored and conceded per half, then adjusting for weather forecast and venue characteristics. When my projected total diverges from the bookmaker’s line by more than four points, that is usually an actionable signal.
Try scorer markets are the most volatile and, counterintuitively, the least efficient. Bookmakers price them largely on reputation and recency — the winger who scored a hat-trick last weekend will be shortest in the first try scorer market regardless of whether the upcoming opponent’s defensive structure targets the opposite channel. If you track carries per game, line proximity on attacking sets, and finishing rate (tries per carry inside the 22), you can identify underpriced runners who are regularly in the right position but have not scored recently enough to attract market attention.
The principle is simple: match your data to the market that data best predicts. Spreading bets across every available market dilutes focus and guarantees that some of your positions are based on guesswork rather than analysis.

Bankroll Management for a Six-Week Tournament
The RWC is six weeks long. Fifty-two matches. And after the group stage, the knockout rounds come thick and fast with quarter-finals, semi-finals, a bronze match and a final crammed into roughly a fortnight. I have seen sharp bettors blow their entire bankroll by the second week because they over-staked the pool stage and had nothing left when the markets they understood best — knockouts — finally arrived.
The starting point is a dedicated tournament bankroll: a fixed sum you allocate specifically to RWC betting, separate from your day-to-day life. This is not about risk appetite; it is about operational discipline. If your bankroll is exhausted, your tournament is over — regardless of how many matches remain. I set mine before the pool draw and do not top it up under any circumstances.
Fixed-percentage staking is the simplest method and the one I recommend for most punters. Each bet is a set percentage of your current bankroll — typically between 1% and 3%. On a bankroll of 500 pounds, a 2% unit is ten pounds. If the bankroll grows to 600 pounds, the unit rises to twelve pounds. If it drops to 400 pounds, the unit shrinks to eight pounds. This self-adjusting mechanism protects against ruin during losing streaks and compounds gains during winning runs.
The Kelly Criterion offers a more aggressive alternative for bettors who trust their probability estimates. The simplified Kelly formula is: (estimated probability x decimal odds minus 1) divided by (decimal odds minus 1). If you estimate Ireland at a 35% chance and the decimal price is 3.50, Kelly says: (0.35 x 3.50 – 1) / (3.50 – 1) = (1.225 – 1) / 2.50 = 0.09, or 9% of bankroll. Most practitioners use half-Kelly or quarter-Kelly to reduce variance, which brings the stake closer to the 2-4% range anyway. Kelly is powerful but punishing if your probability estimates are off — a miscalibration of even a few percentage points can lead to chronic over-staking.
Tournament pacing is a factor that generic staking advice ignores. I divide the RWC into three phases: pool stage (weeks one to three), knockout stage (weeks four to five), and finals weekend. During the pool stage, I cap myself at 1.5% per bet because the matches are frequent and information is still accumulating. In the knockout rounds, where my models have more data to work with and the matches carry higher analytical edge, I allow up to 3%. Finals weekend is capped at 2% per position — by that point, the market is so efficient that large stakes are rarely justified.

For a deeper dive into staking methods — including unit systems, loss limits, and weekly planning across the full tournament — I have written a separate piece on rugby world cup bankroll management that covers the topic in detail.
Five Mistakes That Sink RWC Betting Accounts
I keep a spreadsheet of every losing bet I have placed at a World Cup. Not to flagellate myself, but because the patterns are instructive. The same five errors appear with depressing regularity — in my own record and in the betting behaviour of everyone I talk to professionally. Here they are, ranked by how much damage they do.
Patriotic bias is number one by a distance. England fans back England. Welsh fans back Wales. Irish fans back Ireland. Nothing wrong with that as entertainment, but it is lethal as strategy. National teams carry emotional weight that distorts risk assessment. I am not asking you to bet against your own side — I am asking you to model them with the same dispassionate rigour you would apply to Fiji or Georgia. If your model says England are a 22% chance and the outright price implies 20%, there is no edge. Move on, regardless of how good they looked in the Six Nations.
Chasing losses in the pool stage is the second-biggest killer. The group phase runs for three weeks and delivers multiple fixtures per day. After a losing Saturday, the temptation is to double the stake on Sunday to “get back to even”. This is the textbook ruin scenario. The pool stage is a marathon, not a recovery session. Losses are information, not injuries. Record them, recalibrate your model if needed, and maintain your staking plan.
Ignoring rest days between matches is an analytical blind spot that costs money. A team playing on four days’ rest against an opponent with a full week will perform measurably worse in the second half — the data across the last three RWCs is consistent on this. Yet most punters do not check the schedule before placing a handicap bet. The rest-day effect is strongest in the over/under market: fatigued teams concede more tries in the final quarter.
Overvaluing early-tournament form trips up bettors every cycle. A dominant pool-stage performance against a tier-two side tells you very little about knockout capability. Japan’s thrilling 2019 pool stage was followed by a comprehensive quarter-final defeat to South Africa. Early form is noise; knockout form is signal. I weight results from the second and third pool matches more heavily than the opener, and I discount any match where the margin exceeded 30 points as structurally uninformative.
The fifth mistake is neglecting the exit. Taking a position and forgetting about it until the final whistle is passive betting. Active betting means monitoring your position, evaluating whether new information has changed the probability, and using cashout or hedging when the expected value of holding the bet has diminished. Not every position needs managing, but your outright bets and accumulators certainly do.

How far in advance should I place Rugby World Cup outright bets?
Ante-post outright bets placed several months before the tournament typically offer longer odds than those available on the eve of the opening match, because bookmakers price under greater uncertainty. If your analysis identifies a team whose price is generous relative to your estimated probability, taking a position early locks in that value. The trade-off is exposure to pre-tournament risks such as injuries and poor form. A practical approach is to place a partial stake early — perhaps half your intended position — and reassess after squad announcements and warm-up fixtures.
Which statistical metrics matter most for predicting RWC match outcomes?
Points differential per match is the single most predictive metric for tournament rugby outcomes, followed by tries scored and conceded per game, set-piece efficiency (lineout win rate and scrum penalty ratio), and discipline (penalties conceded per match). These four inputs, weighted by opponent quality, produce a composite rating that outperforms gut feeling or media narratives. Win percentage alone is a weak predictor because it does not distinguish between tight victories and dominant ones.
Is it better to specialise in one RWC betting market or spread across several?
Specialisation outperforms diversification in most scenarios. Each market type — outright, handicap, over/under, try scorer — responds to different data inputs and requires a distinct analytical framework. Spreading across all of them without depth in any dilutes your edge. Choose the market that aligns with the data you analyse most effectively: if you model points differential well, focus on handicaps and totals; if you evaluate squad depth and tournament trajectory, focus on outrights. You can always expand once your primary market is consistently profitable.
